
Graphtool can be used for any measurement purposes where only two columns of data are to be measured.
***** NEW ***** version 2.0.0.8 released - fixing a lot of bugs and adding new features.
Features
- Create logarithmic (default) or linear graphs.
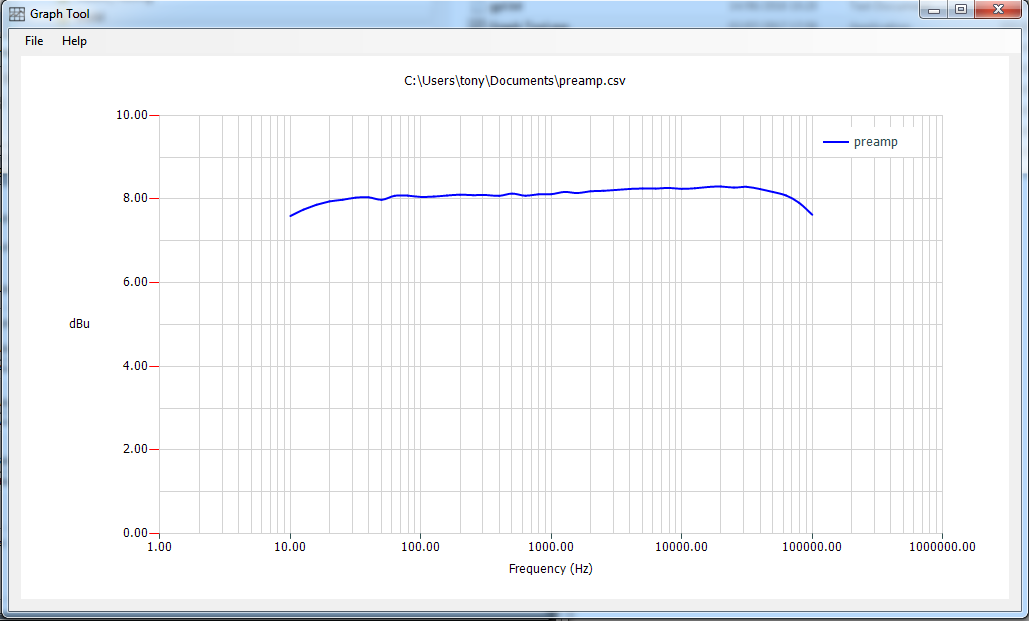
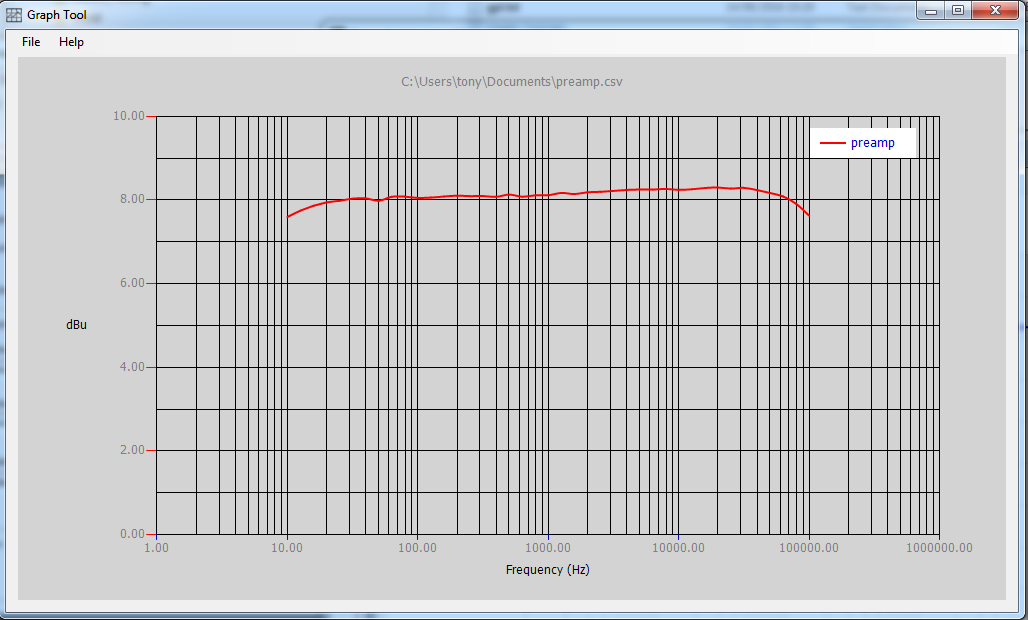
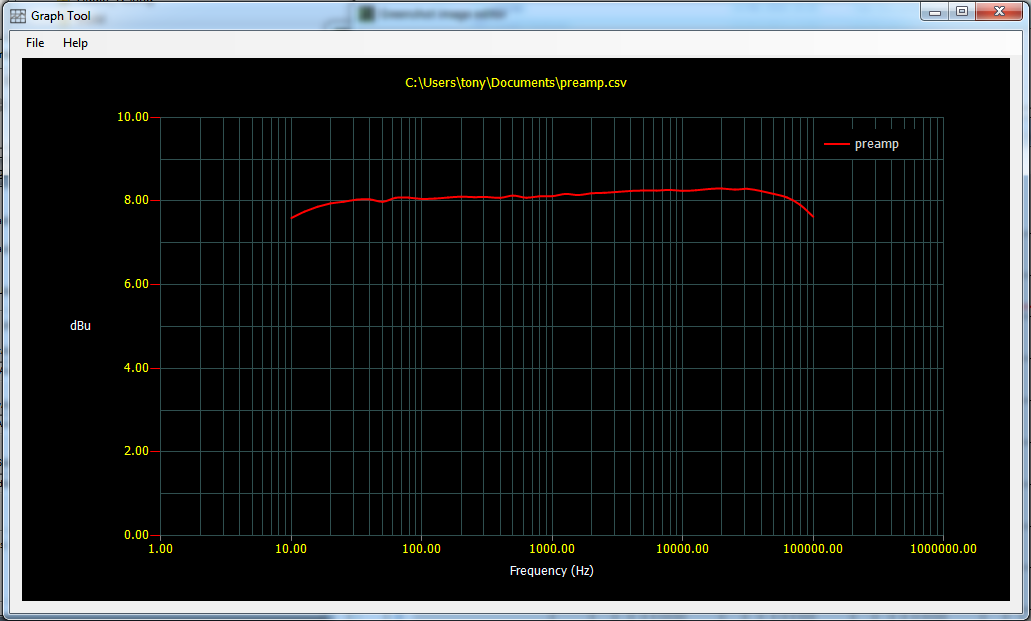
- Three selectable color schemes (Light, Medium, Dark)
- Customisable Axis names.
- Graph will resize as window size changed.
- Selectable working folder (users 'My Documents' by default).
- Graph can be printed using the standard windows printer, will be autosized according to paper size
- X and Y ranges can now be customised, or simply set to autorange
- Graph can be copied to clipboard
- For electronics users, data can now be converted from vRMS to dB
- It's free!!!!
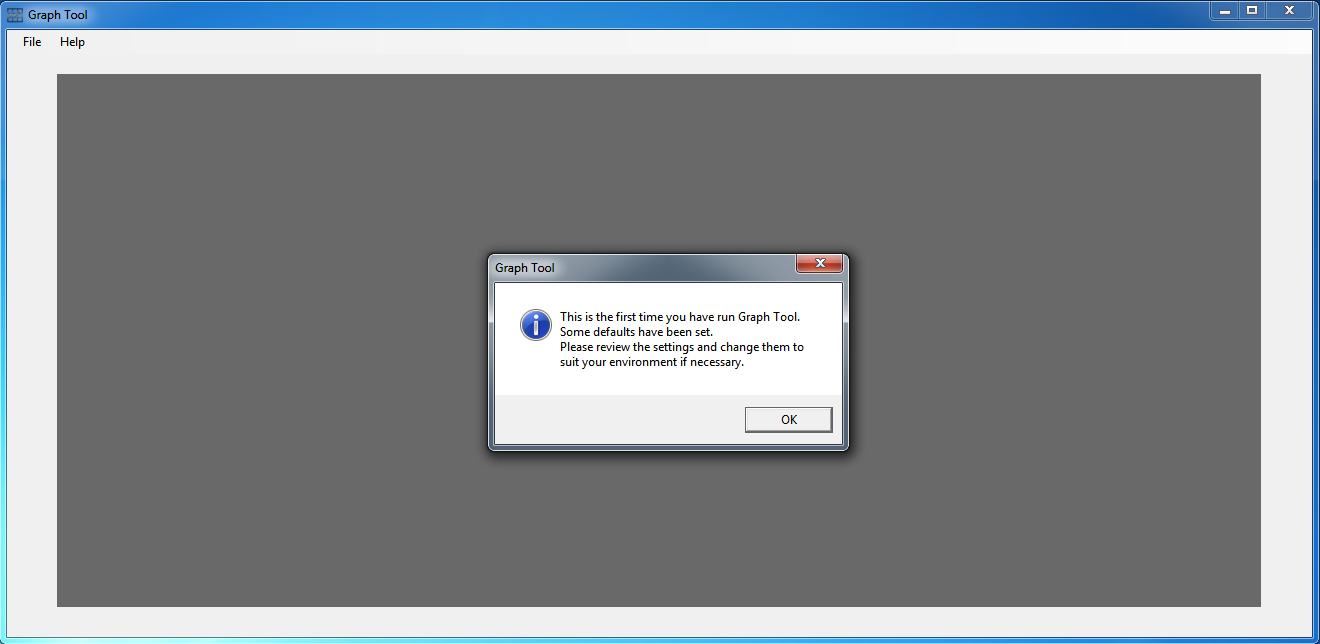
Once Graphtool is loaded, you can simply select a file to graph using the defaults. If you want to change settings, this is detailed below.
Once a file has been selected, the graph will be automatically drawn.
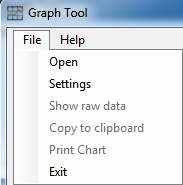
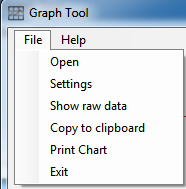
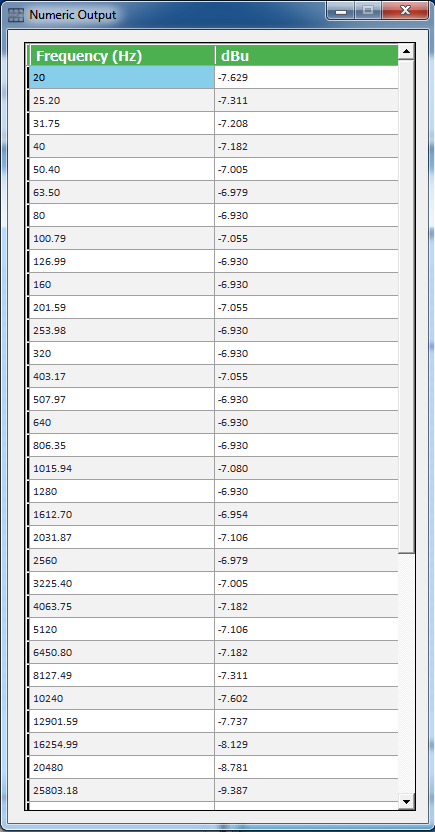
At this point the additional menu options 'Show raw data' and 'Print Chart' will become available.
Configuring GraphTool
To perform additional configuration, click on the 'Settings' option in the 'File' menu. This will take you to the settings screen.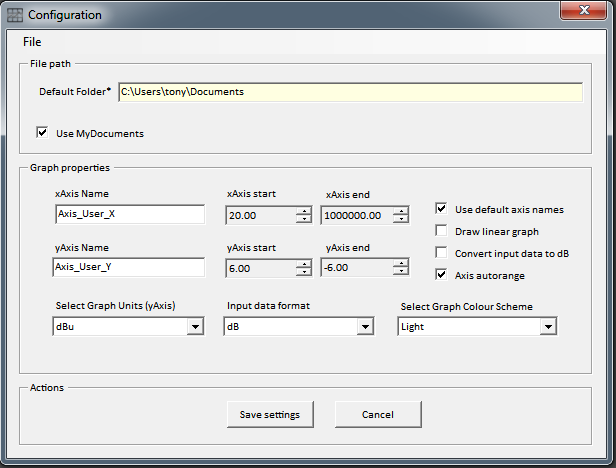
Change default settings.
Here you can define your own Axis names, change the default graph colour, and opt to draw a linear graph (logarithimic is the default).Instead of using 'My Documents' as the default folder, you can click on the 'Use My Documents' option to uncheck it and select your chosen default folder.
If you want to draw a linear graph, simply check the 'Draw Linear Graph' box.
All changes made here will be saved and restored each time you restart GraphTool.
Some sample screenshots.
Note: the graph screen was reduced to a small size to capture these screenshots. The graph can be displayed fullscreen,and does in fact stretch fully across my dual monitor setup making it 3200 pixels wide, so it should size up to a larger screen (not tested!)
Last update: 11th July 2016
Download here.